Punjab Govt, DronaMaps leverage data solutions to reach covid patient
July 07, 2021 | Wednesday | News
The command centre will guide Asha workers on the ground without losing sight of any patient
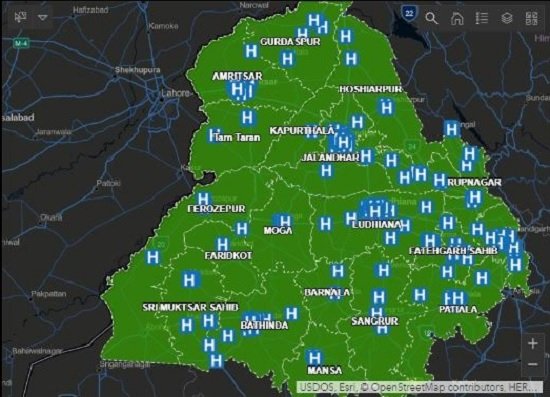
Punjab Government powered by DronaMaps - NASSCOM Center of Excellence (a joint initiative of MeitY and state governments) is leveraging advanced geospatial analytics to reach every covid patient and check infections from spreading especially in remote areas. With a scalable technology interface between citizens and decision-makers, it will also guide a large Rapid Response Team (Asha workers) on the ground without losing sight of any patient.
According to Ajoy Sharma, Secretary, Department of Local Govt, Punjab, the solution works at two levels. First, at the macro level with both the digital and physical control rooms tracking bed availability, oxygen, helplines, and analytics built-in for predicting the future trends. This further feeds a WhatsApp chatbot-based two-way communication pathway. In addition, the command centre also monitors the vitals/symptoms of each case by reaching out on WhatsApp chats and connecting them to medical professionals.
In the data collection and dissemination procedure, the command centre is designed to be proactive and provides a holistic 360-degree view of the current status by integrating different data sources, covering patients, healthcare infrastructure, and adapting to new challenges like mucormycosis and oxygen shortage by creating interoperability in siloed datasets.
“One of the bottlenecks we were trying to solve is ensuring that predictive analytics provide sufficient forewarning for creating healthcare infrastructure. What that means is, we need to understand the number of active cases, doubling time, demographics, hospitalisation trends to have an understanding of the predicted healthcare infrastructure required in that particular district and how it varies across rural and urban areas," says Ayushi Mishra, COO & Co-Founder, DronaMaps.
She further informs, "We created strategy simulators for assessing the impact of policy decisions like implementation of the stay-at-home order, lockdowns, or containment zones based on data models that are specifically calibrated for each district. As the command and control centre was already integrating data around different types of hospital beds, oxygen consumption, testing, and vaccines, we took them into account for informing localised dynamic decision making.“
With the help of GIS dashboards, automated updation and integration from multiple siloed data sources, the control room provides a holistic 360-degree view of the current status. In addition, the spatial, epidemiological, and analytical predictions are also built into the system. The bed availability dashboard gives real-time information about various types of beds available. It gives a macro-level picture for the entire state and can also drill down on the status of bed availability by each hospital. If the control room gets an enquiry at the helpline, it offers information based on this real-time data.